

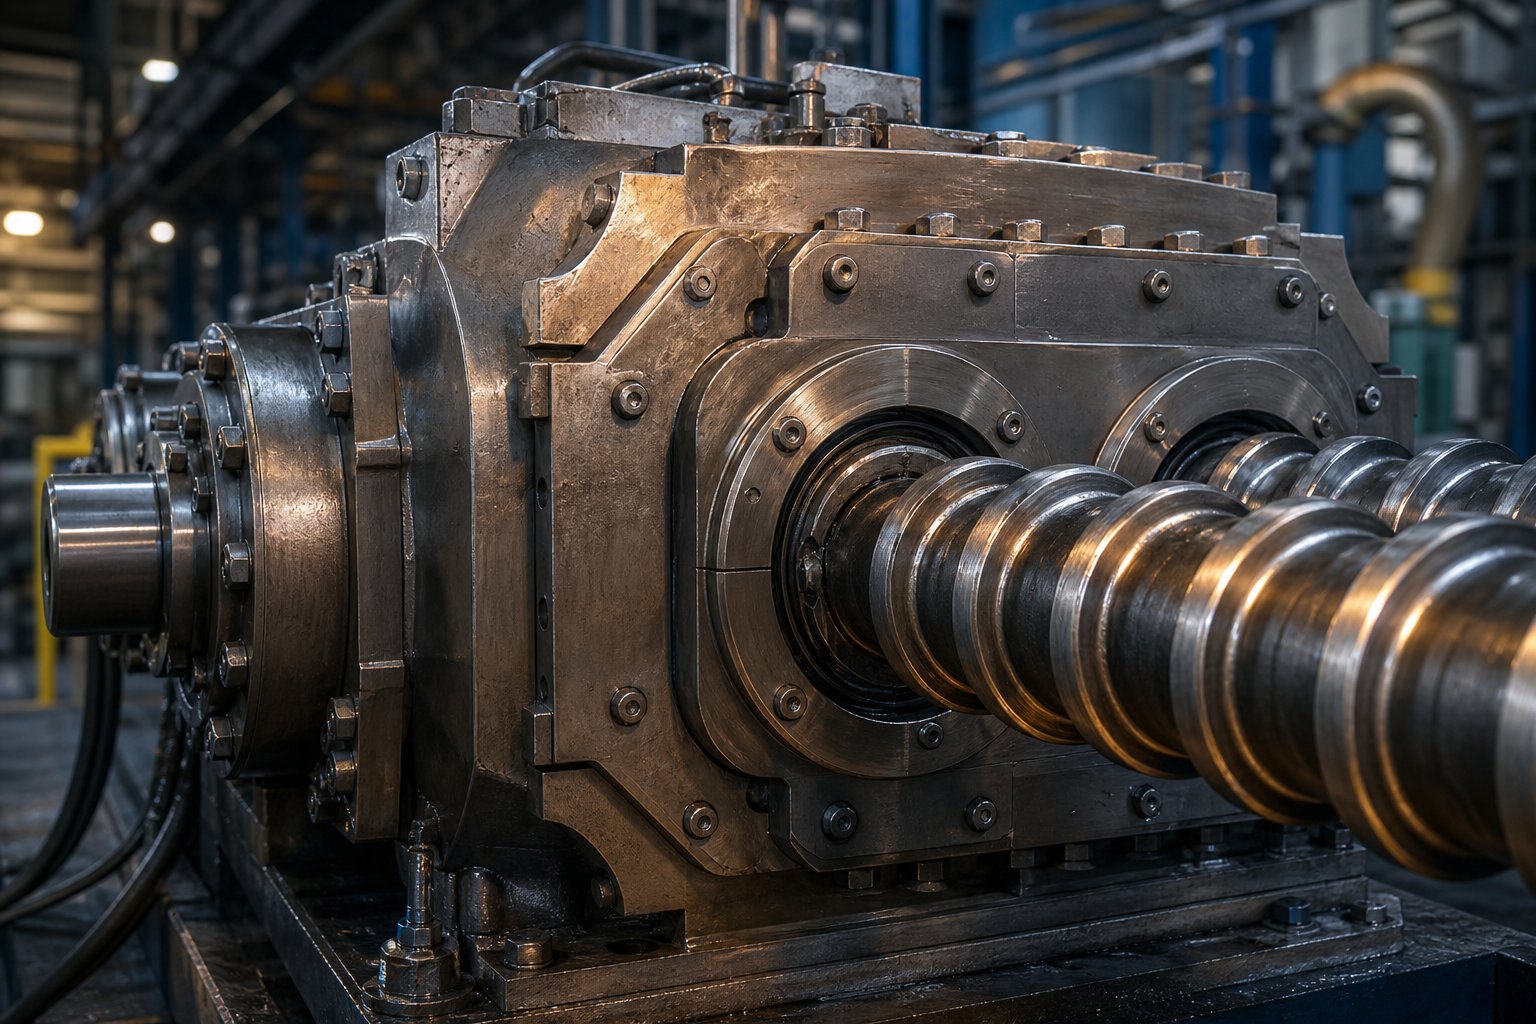
Why Twin Screw Extruder Torque Calculation Matters for Every Process Engineer
Twin screw extruder torque calculation is the process of determining the rotational force each screw shaft must deliver to convey, melt, mix, and pressurize polymer material at a target throughput and screw speed. Get this number wrong in either direction and you pay a steep price: undersized torque leads to gearbox failure and unplanned production shutdowns, while oversized torque means capital wasted on motor and drivetrain capacity you will never use.
What makes this calculation surprisingly tricky is that formulas, operating data, and interpretation guidelines tend to live in separate silos - scattered across OEM spec sheets, academic papers, and tribal knowledge on the plant floor. This guide brings all of those pieces together into a single engineering reference, covering the core equations, torque density benchmarking, control panel interpretation, scale-up methodology, and material-specific estimation.
What Twin Screw Extruder Torque Calculation Actually Means
Imagine you're turning a wrench to loosen a rusted bolt. The force your hand applies, multiplied by the wrench length, is torque. Inside a twin screw extruder, exactly the same principle applies - except the "wrench" is each screw shaft, and the "resistance" is molten polymer fighting against being conveyed, sheared, and pushed through a die.
Twin screw extruder torque is expressed in Newton-meters (Nm) acting on each shaft. It is critical to distinguish torque from power. Power combines torque and speed into a single energy-rate value (watts or kilowatts), but torque alone represents the raw rotational force the drivetrain must withstand at any given instant. In most extrusion operations, torque - not power - is the limiting mechanical constraint. A motor might have plenty of kilowatts available, yet the gearbox cannot safely transmit the force those kilowatts imply at low screw speeds. This is precisely why a high torque twin screw extruder commands a premium: its gearbox and shaft metallurgy are engineered for greater rotational force, expanding the feasible processing window.
Why Every Extrusion Engineer Needs This Skill
You'll encounter three situations where the ability to calculate and interpret torque separates confident engineering decisions from expensive guesswork:
- Evaluating a new formulation on an existing machine. Switching from neat polypropylene to a 50% calcium carbonate-filled compound can push torque utilization from a comfortable 55% to a risky 90%. Running the numbers first prevents a trial that trips the torque overload alarm - or worse, damages the gearbox.
- Comparing extruder models from different OEMs. One manufacturer lists total gearbox torque; another lists per-shaft torque. Without normalizing these values, a side-by-side comparison is meaningless. Torque calculation skills let you cut through spec-sheet inconsistencies.
- Scaling a process from lab to production. A formulation that runs beautifully on a 27 mm pilot extruder still needs its torque requirements translated to a 92 mm production machine. The physics of that translation depend on understanding how torque scales with screw geometry.
Torque is the gearbox's load limit - exceed it, and you damage the most expensive component in the drivetrain.
This reality carries real financial weight. Peak torque during startup with cold material can exceed steady-state running torque by 20-40%, which means even a correctly sized gearbox operates closer to its ceiling than many engineers realize. Understanding the math behind these loads is not optional - it is the foundation for every motor sizing decision, screw design change, and throughput optimization you will ever make on a high-torque twin screw extruder.
The equations that underpin all of these decisions start with one deceptively simple relationship between power, speed, and rotational force.
Fundamental Torque Equations Every Engineer Should Know
That relationship between power, speed, and rotational force fits into a single equation - and every twin screw extruder torque calculation you will ever perform traces back to it. Yet the formula itself is only the starting point. Applying it correctly requires knowing which torque value your OEM datasheet actually reports and how the gearbox transforms motor output before it reaches the screw shafts.
The Power-Torque-Speed Equation
Here is the core relationship:
P = (2π × N × Ttotal) / 60
Where P is motor power in watts, N is screw speed in revolutions per minute (RPM), and Ttotal is total torque in Newton-meters. This equation simply states that power equals torque multiplied by angular velocity - a universal principle of rotating machinery.
Rearranging to solve for torque gives you the form you will use most often:
Ttotal = (P × 60) / (2π × N)
Why does this matter in practice? Because your extruder's control system logs power consumption in kilowatts, and you need to translate that energy data into the actual rotational force acting on the drivetrain. Multiply kilowatts by 1,000 to get watts, plug in screw speed, and you have total torque.
| Variable | Symbol | SI Unit | Description |
|---|---|---|---|
| Motor Power | P | W (watts) | Electrical power delivered by the drive motor |
| Screw Speed | N | RPM (rev/min) | Rotational speed of the extruder screws |
| Total Torque | Ttotal | Nm (Newton-meters) | Combined rotational force across both screw shafts |
Sounds straightforward? It is - until you realize that the torque number you just calculated may refer to the entire gearbox output or to a single shaft, depending on context. That distinction alone is responsible for one of the most common sizing errors in the industry.
Total Torque vs Torque Per Shaft
A twin screw extruder has two shafts, and the total gearbox torque is split between them. For co-rotating machines, the split is equal:
Tshaft = Ttotal / 2
This sounds obvious, yet it creates a hidden trap. Some OEM specification sheets list total gearbox torque while others list per-shaft torque - and neither format is universal. If you compare two machines without checking which convention each manufacturer uses, you introduce a 2× error. Imagine selecting a high torque series twin screw extruder based on a spec sheet showing 2,400 Nm, only to discover after purchase that the number represented total torque - meaning each shaft actually receives just 1,200 Nm. That kind of mistake turns what looked like generous headroom into a machine running at its mechanical ceiling.
The fix is simple: always confirm with the OEM whether their published torque figure is total or per-shaft, then normalize everything to per-shaft values before making comparisons.
Accounting for Gearbox Ratio and Efficiency
The equation above gives you torque at the gearbox output. But what about the torque your motor actually produces? The gearbox sits between the motor and the screw shafts, performing two jobs: it reduces speed and multiplies torque by its gear ratio. However, no gearbox is perfectly efficient - some energy is always lost as heat in the gear meshes, bearings, and lubrication system.
The complete relationship linking motor torque to shaft torque is:
Tshaft = (Tmotor × i × η) / 2
Here, Tmotor is the motor output torque in Nm, i is the gearbox gear ratio, and η is the gearbox mechanical efficiency. The division by 2 accounts for the torque split across two shafts in a co-rotating configuration.
Gearbox efficiency typically falls in the 0.95-0.97 range for modern heavy-duty torque transmission systems in twin screw extruders. That 3-5% loss might seem trivial, but it compounds through multi-stage reductions. A three-stage gearbox at 97% efficiency per stage delivers only about 91% overall efficiency, with the remaining 9% converted to heat that the lubrication system must dissipate. When you are calculating whether a machine can handle a demanding formulation, ignoring that efficiency gap means overestimating available shaft torque by nearly 10% - enough to push a borderline application into the danger zone.
A common misconception makes this worse: confusing motor torque with shaft torque. Your motor nameplate shows the torque at the motor output flange. The gearbox multiplies this value by the gear ratio (which might be 10:1, 15:1, or higher), so shaft torque is much larger than motor torque. If your motor produces 200 Nm and the gear ratio is 12:1 at 96% efficiency, each shaft receives (200 × 12 × 0.96) / 2 = 1,152 Nm - not 200 Nm, and not even the 2,400 Nm total that a lossless calculation would suggest.
When specific gearbox efficiency data is available from the machine manufacturer, always use those numbers instead of the general range. Efficiency varies with load, speed, lubricant temperature, and gear accuracy class, so OEM-validated figures for your particular machine give you tighter confidence in the result.
These equations tell you how much torque your machine can deliver. The next question is how to compare that capacity across extruders of completely different sizes - and that requires a metric specifically designed for the job.
Torque Density Explained as the Key Benchmarking Metric
That metric is called torque density, and it is the single most important number for comparing twin screw extruders across different sizes and manufacturers. Raw torque in Newton-meters tells you what one specific machine can deliver. Torque density tells you how efficiently that machine uses its available mechanical envelope - and it lets you place a 27 mm lab extruder and a 92 mm production machine on the same scale.
Understanding Torque Density Md/a³
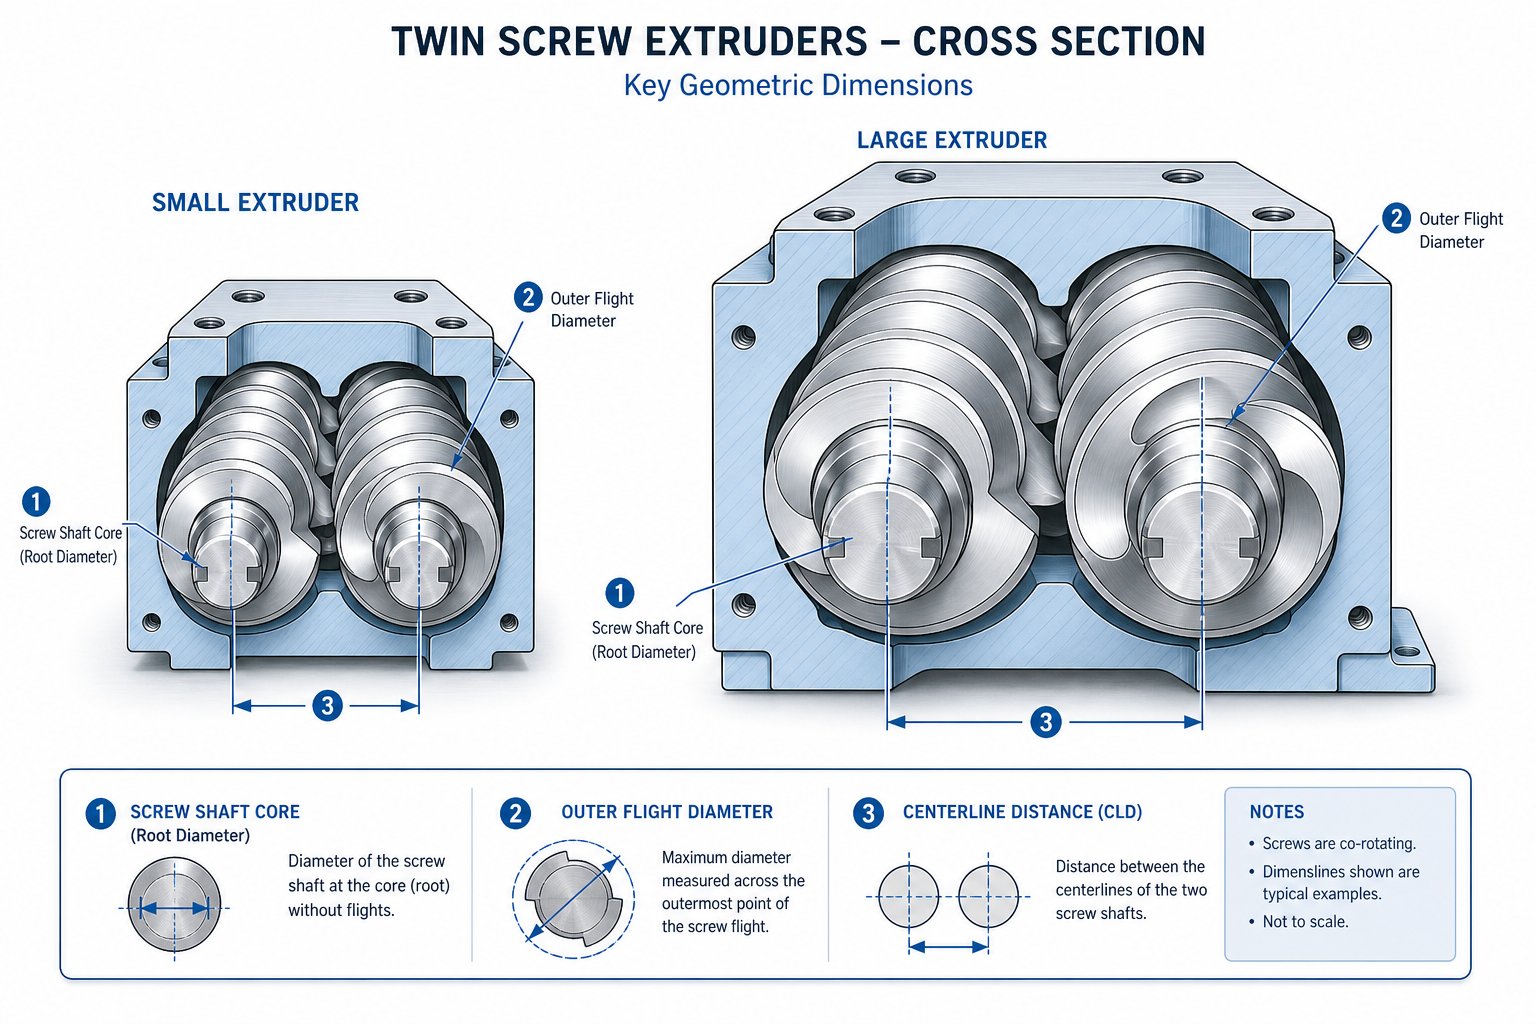
Torque density is defined as the allowable torque per shaft divided by the cube of the centerline distance between the two screws:
Md/a³ = Tshaft / a³
Here, Tshaft is the maximum torque per shaft in Nm, and a is the center distance between the two screw axes in centimeters. The result is expressed in Nm/cm³.
Why cube the centerline distance? Because torque capacity is fundamentally a volumetric problem. The shaft cross-section that transmits force, the spline geometry that transfers load into the screw elements, and the space available for bearings all scale with the third power of the machine's characteristic dimension. Cubing the centerline distance normalizes these geometric relationships so that machines of different sizes can be compared on equal footing.
In practice, the industry recognizes three broad torque density classes, each suited to different processing demands:
| Torque Density Class | Md/a³ Range (Nm/cm³) | Typical Applications |
|---|---|---|
| Standard Torque | ≤ 5 | Color masterbatch, simple blends, low-viscosity polymers |
| High Torque | 5 - 10 | Engineering plastics, moderate filler loading, glass-fiber reinforced compounds |
| Super-High Torque | > 10 | High-fill compounds, reactive extrusion, high-viscosity engineering resins |
A middle torque twin screw extruder sitting around 5-7 Nm/cm³ handles the broadest range of general compounding tasks. But when your formulation demands extreme shear stress - think 60% mineral filler or a high-molecular-weight polyamide with glass fiber - you need a machine in the super-high torque category. Modern high-performance co-rotating extruders now reach torque densities of 18 Nm/cm³, nearly quadrupling what was considered state-of-the-art two decades ago.
How OD/ID Ratio Connects to Torque Capacity
You might wonder: if higher torque density is better, why not just build every machine to the maximum? The answer lies in a fundamental design trade-off governed by the screw outer diameter to inner diameter ratio, commonly written as OD/ID or Do/Di.
Picture the screw cross-section. The outer diameter (Do) defines the barrel bore and the available channel volume for polymer flow. The inner diameter (Di) is the root of the screw - the shaft core that physically transmits torque from the gearbox into each element. A larger OD/ID ratio means deeper screw channels and more free volume for material, but it also means a smaller shaft core relative to the overall screw size. That smaller core limits the torque that can safely pass through the spline connection without risking shaft failure.
This is why the latest co-rotating twin-screw extruders balance specific torque and OD/ID ratio through careful trade-offs rather than simply maximizing one parameter. Typical OD/ID ratios in the industry range from about 1.46 to 1.80. A machine with a 1.55 ratio has a relatively thick shaft core, which favors high torque transmission. A machine with a 1.66 or 1.80 ratio offers significantly more free volume - valuable for processing low-bulk-density materials or achieving higher throughput - but its shaft must work harder to transmit the same torque.
Modern high torque twin screw extruder designs overcome this trade-off through metallurgical advances and improved coupling geometry. Asymmetrically splined shafts, for example, direct tangential force vectors more efficiently into the screw elements, squeezing more torque capacity from the same shaft diameter. Advanced shaft hardening processes and higher-grade steels push the allowable stress limits further. The result is that a well-engineered machine can deliver both generous free volume and impressive torque density - something that was mechanically impossible a generation ago.
Using Torque Density to Compare Extruder Models
Here is where this metric becomes genuinely powerful. Imagine you are evaluating three extruders from different manufacturers: one lists 1,200 Nm per shaft on a 40 mm centerline, another advertises 5,500 Nm per shaft on a 65 mm centerline, and a third offers 18,000 Nm per shaft on a 100 mm centerline. Which machine is actually the most mechanically capable for its size?
Without torque density, you are comparing apples to watermelons. With it, the answer takes seconds:
- Machine A: 1,200 / (4.0)³ = 1,200 / 64 = 18.8 Nm/cm³
- Machine B: 5,500 / (6.5)³ = 5,500 / 274.6 = 20.0 Nm/cm³
- Machine C: 18,000 / (10.0)³ = 18,000 / 1,000 = 18.0 Nm/cm³
All three machines land in the super-high torque class, but Machine B edges ahead in torque density despite having a lower absolute Nm rating than Machine C. This is exactly the kind of insight that raw torque numbers alone cannot provide.
When building a list of high torque series twin screw extruder options for a new project, always normalize every candidate to Md/a³ before making your shortlist. This single step eliminates the most common source of confusion in machine selection and ensures you are comparing true mechanical capability, not just headline numbers inflated by machine size.
Torque density tells you what a machine is built to handle. But on the production floor, you rarely see Nm on the control screen - you see a percentage. Understanding what that percentage actually represents, and how to convert it back into engineering units, is the bridge between machine specs and daily process decisions.
How to Interpret Torque Readings on Your Extruder Control Panel
That percentage on your HMI screen is the number operators watch more than any other - yet surprisingly few people on the plant floor know how to convert it into an actual engineering value. Most twin screw extruder control panels display torque as a percentage of the machine's maximum allowable torque, not as an absolute figure in Newton-meters. This makes perfect sense from a protection standpoint (the drive needs to know how close it is to the mechanical limit), but it leaves a translation gap for anyone trying to perform a twin screw extruder torque calculation with real-world process data.
Percent Torque vs Absolute Torque in Nm
The conversion itself is straightforward:
Tactual (Nm) = (Torque % / 100) × Tmax
Here, Tmax is the rated maximum torque per shaft listed on the machine datasheet. If your screen reads 75% and the machine is rated for 800 Nm per shaft, the screws are experiencing 600 Nm of actual rotational force at that moment.
Simple as this sounds, the practical value becomes clear when you line up several readings side by side and map them against operational risk zones. Consider a machine rated at 800 Nm per shaft:
| Displayed Torque (%) | Actual Shaft Torque (Nm) | Operating Zone |
|---|---|---|
| 40% | 320 | Light load - significant headroom for throughput increase |
| 65% | 520 | Moderate load - comfortable steady-state range |
| 85% | 680 | High load - approaching mechanical limits; monitor closely |
At 40%, you have ample capacity to increase feed rate or run a more viscous formulation. At 65%, the machine operates well within its design window. At 85%, you are entering territory where a small process upset - a feeder surge, a cold barrel zone, or a plug of undispersed filler - could spike torque past the safety threshold and trigger a drive fault or, worse, a mechanical clutch release.
What Torque Percentage Tells You About Your Process
Think of the torque percentage as a real-time stress test for your drivetrain. It answers one critical question: how much of the gearbox's mechanical budget is the current process consuming?
Sustained operation above 80-85% torque is a warning sign. It does not necessarily mean something is wrong right now, but it does mean the process is running with minimal safety margin. In this range, common corrective actions include:
- Increasing screw speed - distributes the same work over more revolutions, reducing the force required per revolution.
- Reducing throughput - lowers the mass of material the screws must push, shear, and pressurize each second.
- Raising barrel temperatures - decreases polymer melt viscosity, which directly reduces the shear stress resisting screw rotation.
Conversely, if your process consistently runs below 40-50% torque, the machine may be oversized for the application. That is not just wasted capital on the initial purchase - it also means the gearbox bearings operate below their optimal load range, which can paradoxically shorten bearing life due to skidding and inadequate load zone formation.
As a practical reference, industry experts recommend maintaining specific energy and torque records for every product, because a sudden change in torque percentage at unchanged process settings strongly implies that the incoming feedstock has shifted - a diagnostic insight that raw Nm values alone would not reveal without baseline context.
Converting Control Panel Data to Specific Energy
Here is where the torque percentage reading becomes genuinely powerful: it lets you calculate specific energy input (SEI) in real time, directly from the values already on your screen.
The applied motor power can be derived from the torque reading using the relationship outlined in twin-screw extrusion fundamentals:
kWapplied = kWmotor rating × (Torque % / 100) × (RPMrunning / RPMmax) × η
Then specific energy follows immediately:
SEI = kWapplied / Throughput (kg/hr)
For example, imagine a 40 mm twin screw extruder with a 56 kW motor, a maximum screw speed of 600 RPM, and a gearbox efficiency of 0.97. The machine is processing a mineral-filled polypropylene compound at 160 kg/hr, running at 400 RPM with a displayed torque of 68%. The applied power is:
56 × 0.68 × (400 / 600) × 0.97 = 24.6 kW
And the specific energy input is:
24.6 / 160 = 0.154 kWh/kg
This number tells you exactly how much mechanical energy the screws are depositing into every kilogram of product. It is the single most valuable quality indicator available from the control panel, because a consistent SEI generally means consistent product. If your torque percentage shifts but you have also changed screw speed or feed rate, the raw percentage alone cannot tell you whether the process has truly changed. SEI can - because it normalizes for all three variables simultaneously.
Operators who learn to mentally estimate SEI from the three displayed values - torque percentage, screw RPM, and feed rate - develop an intuitive sense for process health that no alarm system can replace. They see the torque tick up from 65% to 72% and immediately check whether throughput also changed, or whether the extra load signals a genuine process shift worth investigating.
Of course, specific energy is not just a monitoring tool. It is also the foundation for predicting torque requirements when you scale a process to a different machine size or formulation - a relationship that becomes even clearer when you examine how throughput and screw speed interact mathematically with torque demand.
Specific Energy Input and Its Mathematical Link to Torque
The previous section showed how to calculate SEI from control panel readings - working forward from displayed torque to energy per kilogram. But the real engineering power of this relationship runs in the opposite direction: starting from a target SEI for a given polymer and working backward to determine exactly how much torque the machine must deliver. That reverse calculation is the foundation of every twin screw extruder torque calculation performed during process development, machine selection, and scale-up.
The SEI-Torque Relationship
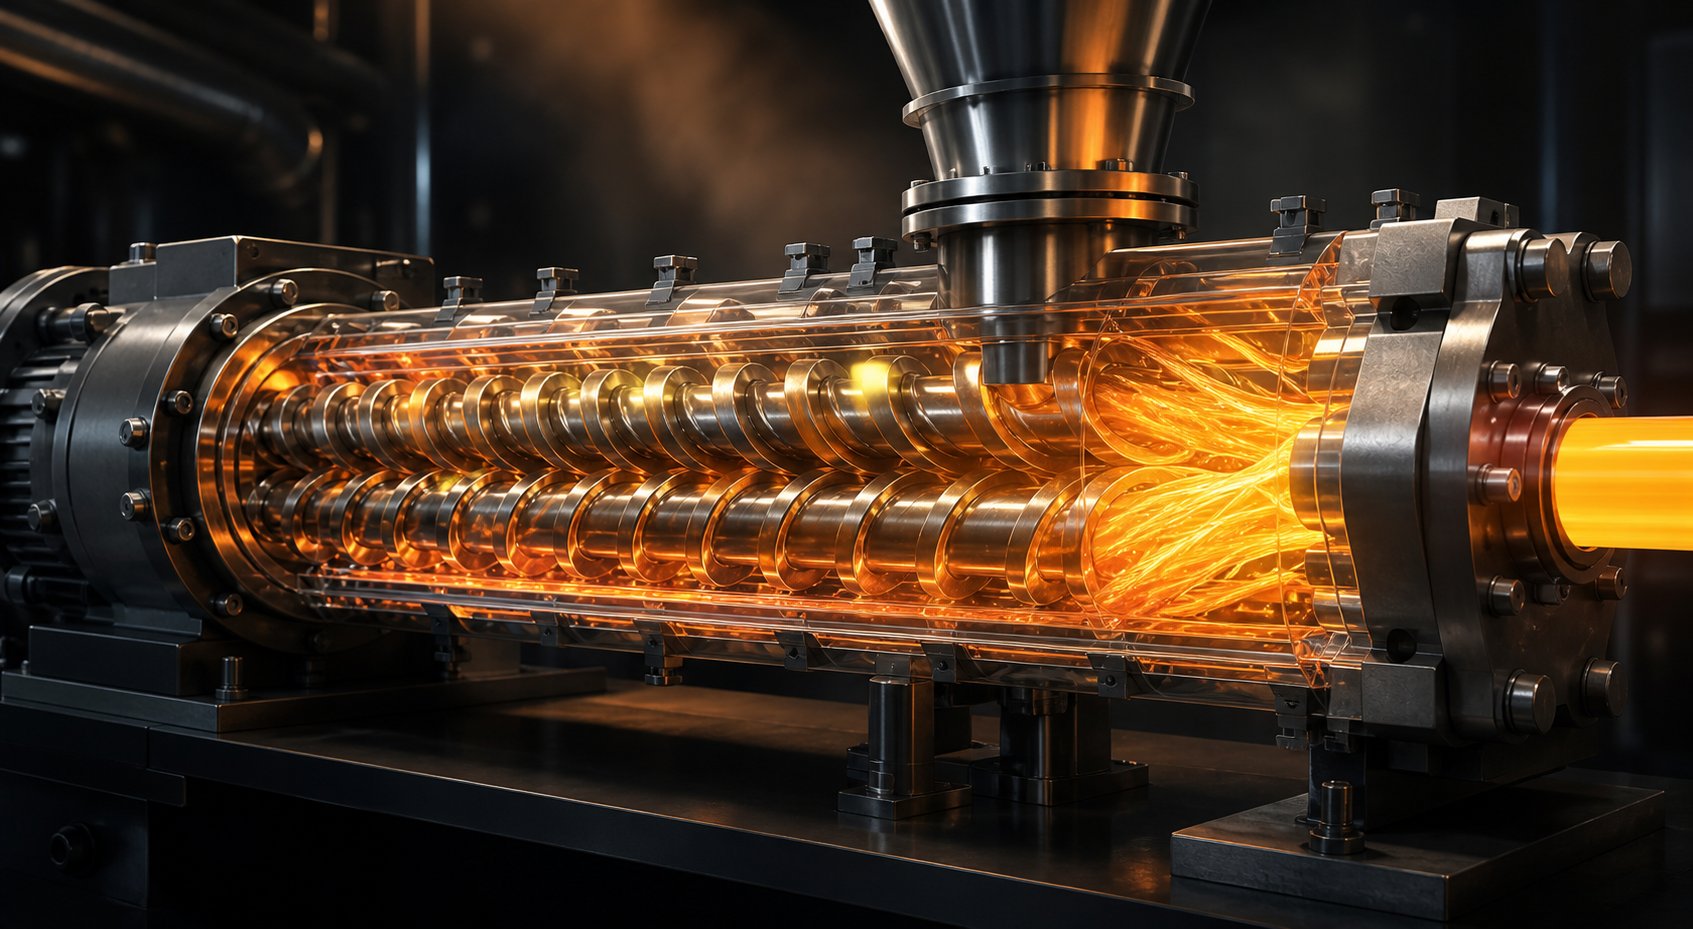
Specific energy input quantifies the total mechanical energy the screws deposit into each kilogram of material passing through the extruder. Expressed in its most fundamental form, the relationship is:
SEI = (2π × N × T) / Q
Here, SEI is specific energy input in kJ/kg, N is screw speed in revolutions per second (rev/s), T is torque in Nm (per shaft, for the single-shaft form, or total - just be consistent), and Q is mass throughput in kg/s. The equation simply says that the energy entering the polymer equals the rotational work the screws perform, divided by the mass flow rate receiving that work.
Why is SEI so important? Because it captures what the polymer actually experiences, regardless of machine size. A polycarbonate compound that achieves optimal dispersion at 0.20 kWh/kg on a 27 mm lab extruder will need approximately the same SEI on a 75 mm production machine - even though the absolute torque and power values differ by orders of magnitude. This makes SEI the single most reliable scale-up parameter in twin screw extrusion, a point emphasized by industry experts who rank it as the most important formula for anyone operating a co-rotating twin screw extruder.
Rearranging to solve for torque gives you the prediction tool you need during process planning:
T = (SEI × Q) / (2π × N)
This says: if you know the SEI your polymer demands, the throughput you want, and the screw speed you intend to run, the required torque is fully determined. There is no ambiguity and no room for guesswork. Either the machine's rated shaft torque exceeds this calculated value (with safety margin), or it does not.
Consider a practical scenario. You are planning to compound a glass-fiber-reinforced polyamide that historically requires 0.25 kWh/kg (which equals 900 kJ/kg) of specific energy. Your target throughput is 500 kg/hr (0.139 kg/s) at a screw speed of 600 RPM (10 rev/s). Plugging in:
T = (900 × 0.139) / (2π × 10) = 125.1 / 62.83 ≈ 1,991 Nm total, or roughly 996 Nm per shaft.
If your machine is rated at 1,200 Nm per shaft, you have about 17% headroom - enough for normal process variability but uncomfortably thin if cold-start torque spikes are factored in. That single calculation just told you whether the project is feasible before a single pellet enters the hopper.
How Throughput and Screw Speed Affect Torque Demand
The rearranged equation reveals something important about how the three process variables - throughput, screw speed, and torque - interact. Imagine holding two of them constant and changing the third:
Increasing throughput at constant screw speed raises torque demand roughly in proportion. Push the feed rate from 500 to 600 kg/hr without touching the RPM dial, and the screws must deliver about 20% more rotational force to maintain the same energy input per kilogram. More material in the channels means more viscous resistance on every flight surface.
Increasing screw speed at constant throughput generally decreases the torque required per revolution - but the motor must deliver higher power. The same total work is distributed across more revolutions, reducing the instantaneous load on the gearbox while increasing the energy-rate demand on the motor. This is the fundamental trade-off that defines high-speed extrusion strategy.
The practical implications of these relationships ripple through every process optimization decision:
- If a process is torque-limited (running near 80-85% of rated torque), raising screw speed while holding throughput constant reduces torque percentage and creates headroom - provided the motor has spare power capacity.
- If a process is power-limited (motor at maximum kW output), reducing screw speed at the same throughput lowers the power draw but increases torque demand per shaft. You shift the constraint from motor to gearbox.
- Maximizing throughput on a given machine requires finding the screw speed that positions the process at the intersection of the torque ceiling and the power ceiling - the point where both resources are fully utilized simultaneously.
- For shear-sensitive materials, lower screw speed at higher fill levels (higher Q/N ratio) reduces peak shear rates in the overflight gap while increasing torque demand. The formulation's thermal sensitivity, not just the mechanical limits, often determines the optimum operating point.
These interactions explain why experienced operators instinctively pair feed-rate changes with screw-speed adjustments rather than moving one variable in isolation. Every change ripples through the torque-power-throughput triangle.
High-Speed Extrusion and the Torque-Speed Envelope
The interplay between torque and speed becomes especially important when evaluating high torques twin screw extruder platforms designed for elevated RPM operation. The concept known as high-speed energy input (HSEI) captures this design philosophy: rather than delivering energy through brute rotational force at low speed, HSEI machines distribute the same (or greater) total energy across many more revolutions per minute.
Here is the key insight. A 200 kW motor geared for 600 RPM delivers exactly the same torque as a 400 kW motor geared for 1,200 RPM - roughly 3,183 Nm total across both shafts. At any speed below 600 RPM, both configurations are mechanically identical. The larger motor only provides an advantage when the process genuinely benefits from screw speeds above 600 RPM, where the higher power sustains adequate energy input even as per-revolution torque drops.
Visualize the torque-speed operating envelope as a rectangle. The vertical axis is torque per shaft (capped by the gearbox rating), and the horizontal axis is screw speed (capped by the motor's power at maximum torque). The area inside that rectangle represents every feasible combination of torque and speed the machine can sustain.
A super-high torque series twin screw extruder expands this envelope upward - allowing higher shaft loads at any given speed. A high-speed machine extends it to the right - permitting faster screw rotation for a given power budget. The most capable modern platforms, which have progressively pushed torque density boundaries, expand the envelope in both directions simultaneously, giving process engineers the widest possible window to optimize for different materials and formulations on a single machine.
Why does this matter for torque calculation? Because the envelope defines whether a desired combination of throughput, screw speed, and SEI is physically achievable. If your calculated torque at 400 RPM sits safely within the envelope but your calculated torque at 200 RPM (same throughput, same SEI, but twice the per-revolution force) exceeds the gearbox limit, you know the process cannot run at the lower speed without reducing feed rate. The torque-speed envelope transforms abstract equations into concrete operational boundaries that you can draw, visualize, and present to your production team.
These calculations treat torque as a single aggregate number for the whole machine - total shaft load consumed by the entire screw length. In reality, torque is not distributed evenly along the barrel. Certain screw elements generate far more resistance than others, creating localized torque peaks that the aggregate number conceals. Understanding where those peaks originate, and which element geometries cause them, is the next piece of the puzzle.
How Screw Element Geometry Affects Local Torque Demand
Every equation discussed so far treats torque as a single number - the total rotational resistance the gearbox must overcome at any given moment. But inside the barrel, that resistance is anything but uniform. Some zones barely register on the torque budget, while others consume the lion's share of mechanical energy in just a few diameters of screw length. Understanding which elements create those peaks - and why - is what separates an engineer who calculates torque from one who actually manages it.
Conveying Elements and Their Torque Contribution
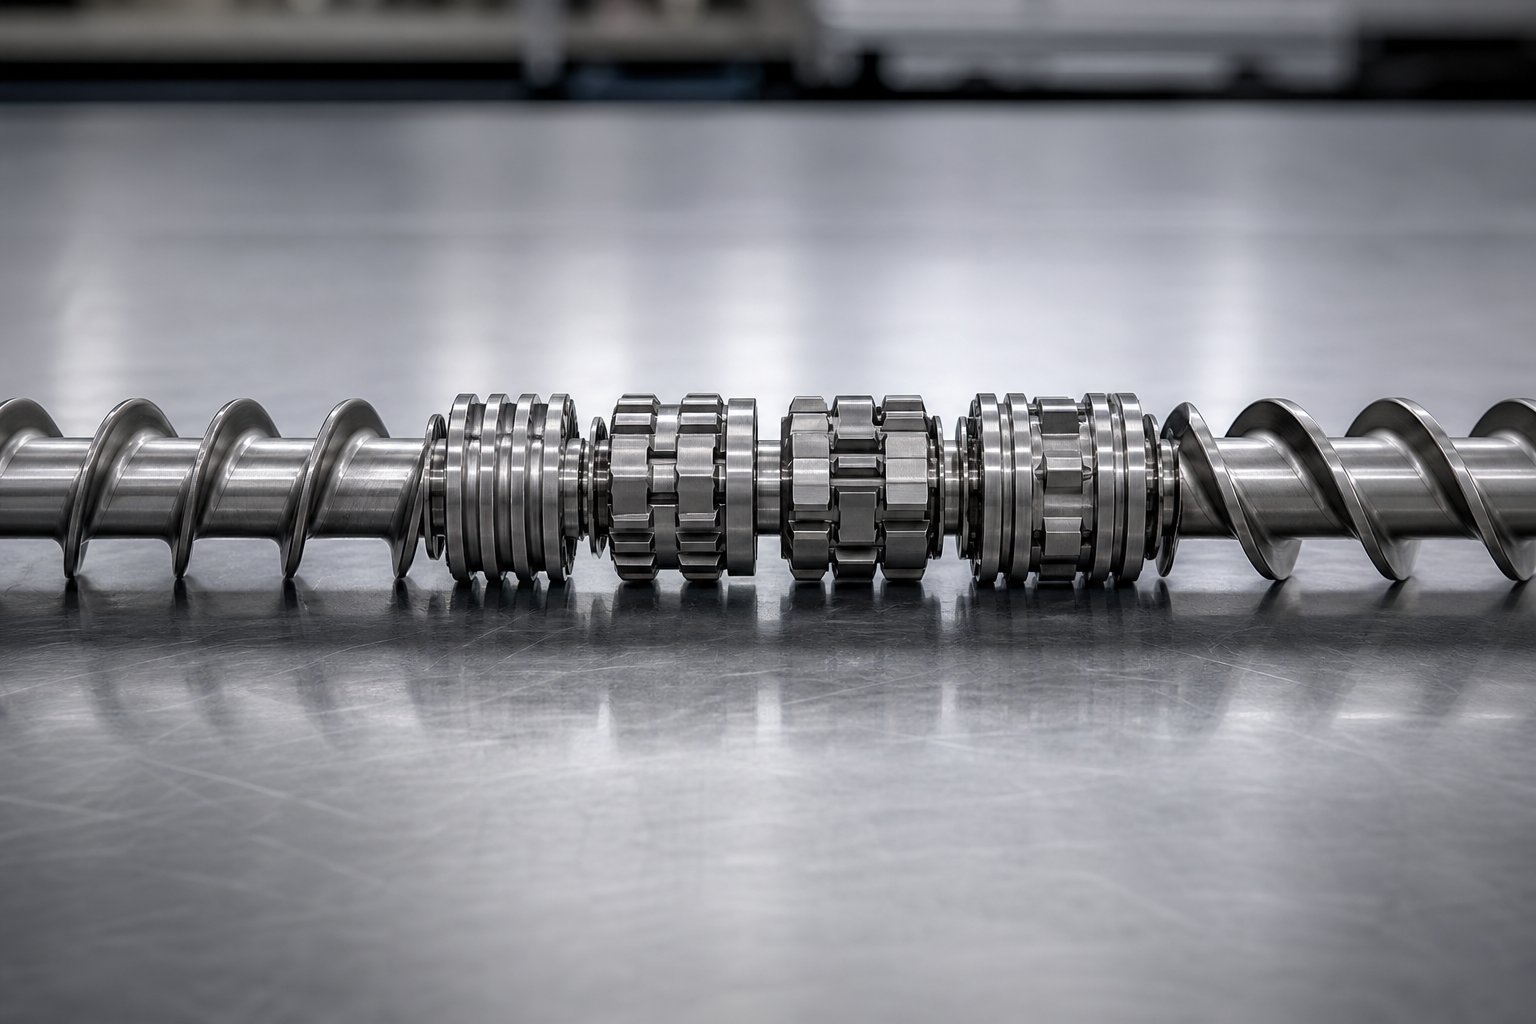
Standard conveying elements, with their helical flights and defined pitch, are the workhorses of material transport. They generate torque primarily through viscous drag: the polymer melt shears between the screw flight surfaces and the barrel wall, and that shear resistance translates directly into rotational force the shaft must overcome.
Here is where operating conditions change the picture dramatically. In starve-fed operation - the normal mode for co-rotating twin screw extruders - conveying element channels are only partially filled with material. Less material contacting the screw surfaces means less viscous drag and, consequently, relatively low torque contribution. You'll notice that conveying zones upstream of any restrictive element typically consume a modest fraction of the total torque budget.
That changes the moment channels become fully filled. When material backs up against a restrictive element downstream - a kneading block, a reverse element, or a narrow-pitch metering section - the conveying elements immediately upstream transition from partially filled to fully filled. The fill level in each section directly controls local shear and temperature development, and a fully filled conveying channel generates significantly more torque than a starved one, even though the element geometry is identical. This is why a seemingly minor change to a downstream element can ripple backward and increase torque consumption in conveying zones that you never touched.
Pitch also plays a role. Smaller pitch increases compression and pressure generation, which raises the local torque demand compared to a coarse-pitch element at the same fill level. Engineers adjusting pitch to build die pressure in the metering zone need to account for the additional torque cost that tighter pitch introduces.
Kneading Blocks and Peak Torque Zones
If conveying elements are the steady background hum of torque consumption, kneading blocks are the sharp crescendos. These elements - stacks of individual discs offset by a defined stagger angle - impose the most intense shear and mixing on the polymer, and they create the highest local torque demand anywhere along the screw.
Three geometric variables determine just how aggressive a kneading block is:
- Disc width. Narrower discs create more frequent changes in cross-sectional flow, generating higher local pressure fluctuations and more opportunities for intense shear. The result is stronger dispersive mixing - and correspondingly higher torque.
- Stagger angle. Higher angles (60° or 90°) dramatically reduce the net forward conveying ability of the block, forcing material to dwell longer in the high-shear zone. The polymer is repeatedly accelerated and decelerated across the disc faces, driving up the rotational resistance the shaft must overcome.
- Conveying direction. Reverse-stacked kneading blocks actively push material backward against the overall flow direction, creating intense pressure build-up upstream and extremely high local shear stress. These elements are the single largest torque consumers in most screw configurations.
Imagine running a super-high torque twin screw extruder at 500 RPM with a moderate throughput of filled polypropylene. A section of wide-disc, low-angle forward kneading blocks might contribute 8-12% of total torque. Replace those same blocks with narrow-disc, 90° neutral kneading elements, and that zone's torque contribution can double or more - without changing a single process setpoint. The geometry alone reshapes the torque profile along the barrel.
This is also where torque spikes originate. During startup with cold or partially melted material, kneading zones encounter material at its highest viscosity. The shear stress the polymer exerts on the disc faces peaks sharply, and the instantaneous torque in that zone can far exceed steady-state values. This is precisely why super high torque twin screw extruder platforms with generous torque headroom are preferred for formulations that involve demanding melting or dispersion requirements - the steady-state average may look comfortable, but the transient peaks tell a different story.
How Screw Configuration Drives Total Torque
Total measured torque on the control panel is the cumulative sum of every resistance along the entire screw length - from the first conveying element under the feed throat to the last flight before the die adapter. Each element adds its share, and the overall torque is simply their combined effect.
This means that two screw configurations running the same material at identical throughput and speed can produce dramatically different torque readings. An aggressive configuration with multiple dispersive kneading zones, tight-pitch metering sections, and reverse elements will consume substantially more torque than a gentle mixing configuration built around wide-disc distributive elements and generous conveying pitches. The difference is not subtle - it can easily be 20-40% of total torque utilization.
To build intuition for which elements contribute most, here is a general ranking from lowest to highest typical torque demand:
- Partially filled conveying elements (lowest torque contribution)
- Fully filled conveying elements
- Forward kneading blocks (moderate stagger angle)
- Neutral kneading blocks (90° stagger, zero net conveying)
- Reverse kneading blocks (negative conveying, intense back-mixing)
- Reverse conveying elements (highest local torque contribution)
This ranking explains why screw design optimization is central to managing torque utilization. An engineer who needs to reduce torque on a machine running near its limit does not necessarily have to cut throughput or raise barrel temperatures. Swapping a dispersive element for a more distributive one, shortening a kneading block by one or two discs, or replacing a reverse element with a neutral block can meaningfully lower the torque peak in that zone - often without sacrificing product quality, provided the change is guided by an understanding of what each element contributes to the mixing objective.
This element-level perspective also highlights a critical nuance for anyone performing a twin screw extruder torque calculation during process development: the same machine, same motor, and same gearbox can be torque-limited or comfortably within range depending entirely on how the screw is built up. Torque capacity is a property of the drivetrain. Torque demand is a property of the screw configuration, the material, and the process conditions working together.
And of all those factors, material properties are the one that varies most from project to project. Different polymers, filler systems, and additive packages create vastly different viscous loads on the screw - which means the torque your calculation predicts is only as good as your understanding of what the formulation actually demands.
Matching Torque Capacity to Materials and Formulations
That formulation demand varies enormously. A neat polypropylene at 230°C flows almost like water compared to a 50% glass-fiber-reinforced polyamide 6 at the same temperature. Yet both run through twin screw extruders that share the same fundamental drivetrain architecture. The difference in torque consumption between these two materials - at identical throughput and screw speed - can easily exceed a factor of two. Estimating where a specific polymer and filler system will land on that spectrum is arguably the most practical skill a compounding engineer can develop.
Estimating Torque Requirements for Different Polymers
Torque is proportional to the shear stress the polymer melt exerts on the screw surfaces. Shear stress, in turn, depends on two things: the local shear rate (governed by screw geometry and RPM) and the melt viscosity of the polymer at processing conditions. Higher viscosity means more resistance to flow, which translates directly into greater rotational force on each shaft.
Consider the practical range. Low-viscosity polymers like polypropylene (PP) and general-purpose polystyrene (PS) shear easily, generate modest drag on the screw flights, and typically run at comfortable torque percentages even at aggressive throughput rates. High-viscosity engineering resins - HDPE, polycarbonate (PC), polyamide 6 (PA6), and especially high-molecular-weight grades of these polymers - resist shear far more intensely. Processing PA6 with 30% glass fiber, for instance, pushes torque utilization significantly higher than neat PA6 at the same feed rate, because the fiber-filled melt behaves as a substantially more viscous fluid.
This viscosity gap explains why the best high torque series twin screw extruder platforms are not luxuries for engineering-resin compounders - they are necessities. A machine that handles PP masterbatch at 50% torque may hit 90% torque the moment it switches to a glass-fiber-reinforced polyamide, leaving virtually no margin for process upsets or cold-start transients.
Published melt viscosity data for common polymers - available in material datasheets, rheology databases, and capillary rheometer studies - provides the starting point for estimating relative torque demand. While absolute torque prediction requires detailed process simulation, comparing the shear viscosity curves of two candidate polymers at your target processing temperature immediately tells you which one will load the drivetrain harder, and by roughly how much.
Impact of Fillers and Additives on Torque
If neat polymer viscosity sets the baseline, fillers and additives raise it - sometimes dramatically. Adding mineral fillers like calcium carbonate (CaCO3) or talc, reinforcing fibers like glass or carbon, or even high loadings of carbon black increases the effective viscosity of the compound because solid particles disrupt the polymer flow field, increase particle-particle interactions, and resist deformation.
The effect intensifies nonlinearly with loading level. A compound with 20% CaCO3 might increase torque demand by a modest 15-25% over the neat resin. But pushing to 60% filler loading can double or even triple the torque requirement, because the particle packing fraction approaches a critical threshold where the compound behaves more like a dense paste than a flowing melt. Research on glass-fiber-reinforced polypropylene compounds confirms that increasing fiber content from 20 to 40 wt.% meaningfully changes the processing behavior, with higher filler fractions producing shorter fiber lengths due to the elevated shear stresses the compound experiences during extrusion - stresses that directly reflect higher torque consumption.
High-fill formulations above 40-60% by weight routinely push torque utilization to machine limits. For any business evaluating a high torques twin screw extruder for heavily filled compounds, this is the critical sizing criterion: not average torque during steady-state operation, but peak torque during melting and initial dispersion of the filler into the polymer matrix.
Several formulation factors systematically increase torque demand. Recognizing them early prevents undersizing the machine:
- High polymer melt viscosity - engineering resins and high-molecular-weight grades resist screw rotation more than commodity polymers
- High filler loading - mineral fillers, glass fibers, and carbon black all raise effective compound viscosity
- High molecular weight grades - longer polymer chains entangle more, increasing flow resistance at any given shear rate
- Reactive extrusion (crosslinking) - chemical reactions that build molecular weight during processing progressively increase viscosity along the barrel length
- Low barrel temperatures - cooler melt means higher viscosity, which directly raises the shear stress on screw surfaces
Each of these factors acts independently, and they compound when present simultaneously. A reactive extrusion process using a high-molecular-weight base resin with 40% glass fiber at conservative barrel temperatures can easily require the best super-high torque series twin screw extruder available - because every single factor on the list is pushing torque demand upward at the same time.
Practical Approach to Material-Torque Matching
Given the complexity of predicting viscosity from first principles - especially for filled and reactive systems - the most reliable engineering workflow anchors itself to the SEI equation introduced earlier. Here is the recommended sequence:
- Estimate the required SEI. Pull this from published processing data for similar polymers and formulations, from your own small-scale trial results, or from material supplier recommendations. For example, a typical glass-fiber-reinforced compound might require 0.20-0.30 kWh/kg, while a simple color concentrate might need only 0.08-0.12 kWh/kg.
- Define target throughput and screw speed. Choose throughput based on production requirements, and select screw speed based on the shear sensitivity of the material. Shear-sensitive polymers (PVC, certain biopolymers) demand lower RPM; robust commodity resins tolerate much higher speeds.
- Calculate required torque per shaft. Use the rearranged SEI-torque formula: Tshaft = (SEI × Q) / (2π × N × 2). This gives the minimum torque each shaft must deliver to achieve the target energy input at your chosen operating point.
- Compare against machine rated torque. Check that the calculated torque stays below 80-85% of the machine's rated per-shaft torque. If it does not, you have three options: increase screw speed (shifting load from torque to power), reduce throughput, or select a machine with a higher torque rating.
This workflow is deliberately conservative, and for good reason. The SEI-based estimate captures the average energy requirement, but it does not account for transient torque peaks during startup, feeder surges, or localized resistance spikes at aggressive kneading zones. Building in that 15-20% headroom above calculated steady-state torque protects the gearbox against the events that actually cause mechanical failures in practice.
Material-torque matching ensures you choose a machine capable of processing your formulation today. But what happens when you need to move that formulation from a pilot-scale extruder to a full production line? The torque requirements do not simply scale linearly with machine size - they follow geometric rules that demand their own set of calculations.
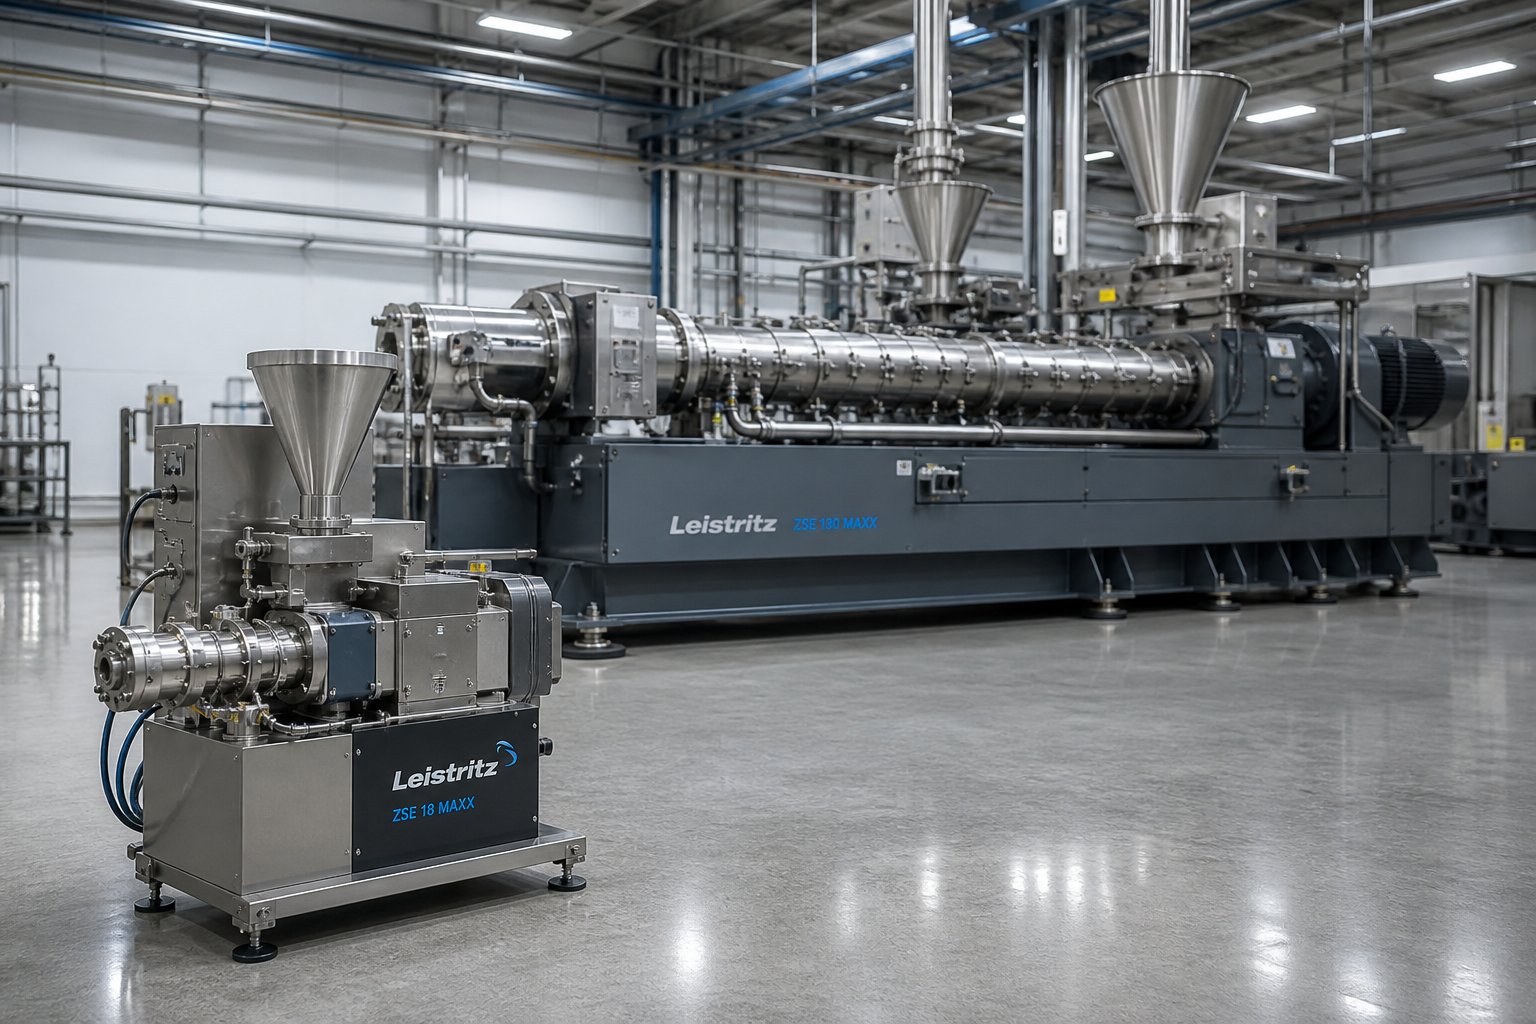
Scale-Up Torque Calculations Using Geometric Similarity
Those geometric rules follow a deceptively elegant logic. A pilot extruder and a production machine share the same fundamental physics - viscous drag, shear stress, pressure generation - but every dimension changes simultaneously when the screw diameter grows. Torque, throughput, and power do not scale by the same factor, and confusing which parameter follows which scaling law is one of the fastest ways to either oversize an expensive drivetrain or, worse, undersize a gearbox that will fail under production loads.
Geometric Similarity and the Scale-Up Rules
When scaling from a smaller extruder (subscript 1) to a larger one (subscript 2) while maintaining geometric similarity - meaning the OD/ID ratio, L/D ratio, and screw element proportions stay constant - volumetric processing capacity scales with the cube of the screw diameter ratio. This is the cubic law, and it applies because the internal flow volume of the extruder is a three-dimensional space:
Q2 = Q1 × (D2 / D1)³
Torque follows the same cubic relationship. Since the shear forces acting on screw surfaces scale with the square of the diameter and the moment arm scales linearly, the net rotational resistance increases with D³. This means torque density (Md/a³) should remain constant across geometrically similar machines running an equivalent process - which is exactly why that metric works so well for cross-machine comparisons.
Power, however, scales differently. Because power equals torque multiplied by angular velocity, and screw tip speed is typically held constant during scale-up (meaning RPM decreases as diameter increases), power scales with a factor between D² and D³ depending on the speed strategy chosen.
Consider a concrete example. You are scaling from a 27 mm lab extruder to a 75 mm production machine. The diameter ratio is 75/27 = 2.78. Under the cubic law, throughput is estimated to increase by a factor of 2.78³ ≈ 21.5. A pilot process running 100 kg/hr would project to roughly 2,150 kg/hr on the larger machine - and the torque requirement scales by that same factor of 21.5.
The following table summarizes how key parameters scale relative to the diameter ratio under geometric similarity at constant screw speed:
| Parameter | Scaling Factor | 27 mm → 75 mm Example (Ratio 2.78) |
|---|---|---|
| Screw Diameter (D) | D2/D1 | 2.78× |
| Volumetric Throughput (Q) | (D2/D1)³ | 21.5× |
| Required Torque (T) | (D2/D1)³ | 21.5× |
| Required Power (P) at constant RPM | (D2/D1)³ | 21.5× |
| Required Power (P) at constant tip speed | (D2/D1)² | 7.7× |
| Barrel Surface Area | (D2/D1)² | 7.7× |
| Free Volume | (D2/D1)³ | 21.5× |
Notice the critical mismatch in that table: volume scales with the cube while surface area scales with only the square. That single geometric fact is responsible for most of the headaches engineers encounter during scale-up - and it is exactly where the neat cubic-law predictions start to break down.
When Scale-Up Rules Break Down
The cubic law assumes that everything about the process stays proportional: identical screw configuration, identical barrel temperature profile, identical fill level, and identical ratio of heat generation to heat removal. In reality, that last condition is almost never true at production scale.
As Technovel's engineering team explains, the internal flow volume rises with D³ while the barrel surface area rises only with D². Because of this geometric difference, the relative effectiveness of heat transfer to the bulk of the material declines as the machine grows. A barrel zone that effectively cooled the melt on a 27 mm extruder may barely influence core melt temperature on a 75 mm machine, because there is proportionally far less cooling surface per unit volume of polymer.
This surface-to-volume shift has direct torque consequences. When the barrel can no longer remove shear-generated heat as efficiently, melt temperature rises. Higher melt temperature reduces viscosity, which lowers torque demand - but it may also degrade the polymer, narrow the processing window, or compromise product quality. Engineers compensating by reducing barrel temperatures or lowering screw speed to limit shear heating will increase torque demand, potentially pushing the production machine closer to its gearbox limit than the pilot data predicted.
This is why scale-up experts emphasize preserving the material's thermal, mechanical, and residence-time experience rather than simply matching equipment dimensions. In practical terms, specific energy input (SEI) is often a more reliable scale-up parameter than torque alone. If you maintain the same SEI across scales, you preserve the total mechanical energy each kilogram of polymer receives - which is what ultimately determines dispersion quality, melt homogeneity, and product performance.
The practical reality, then, is that most scale-up calculations land somewhere between the cubic law and the square law. The cubic law represents the maximum throughput gain (volume-based), while the square law (Q ∝ D²) represents a more conservative, heat-transfer-limited scenario. For processes where devolatilization is the bottleneck, the scale-up exponent typically falls between 2.3 and 2.7 rather than a clean 3.0. And the greater the difference in extruder sizes, the less reliable pure geometric scaling becomes - experience and process-specific data increasingly outweigh theoretical predictions.
For engineers performing a twin screw extruder torque calculation during scale-up, the safest approach is to:
- Use the cubic law as the starting-point estimate for torque requirements at the target throughput
- Verify by calculating the SEI at the projected operating conditions and confirming it matches pilot-scale values
- Apply a thermal correction factor if the production machine has a significantly different surface-to-volume ratio or if the process is known to be heat-transfer sensitive
- Always confirm that the calculated torque per shaft remains below 80% of the production machine's rated capacity, leaving headroom for the startup transients and process variability that pilot trials rarely capture
Working with Custom Screw Design for Scale-Up Confidence
Even with rigorous torque and SEI calculations, successful scale-up frequently demands adjustments to screw geometry that go beyond proportionally enlarging the pilot configuration. Changed heat transfer efficiency at production scale may require relocating or shortening kneading zones to reduce shear heating in regions where the barrel can no longer compensate. Altered residence time distributions may call for modified conveying pitches or additional mixing sections to maintain dispersion quality. And the transient torque behavior during startup - which scales non-linearly and is difficult to predict from pilot data alone - often requires a different balance of restrictive and conveying elements than what worked on the smaller machine.
This is where engineering services specializing in screw geometry become genuinely valuable. NANHAIYA's Custom Screw Design Services, for example, provide screw geometry recommendations, material selection guidance, and processing parameter optimization tailored to specific polymers, machine conditions, and output requirements. For a high torque series twin screw extruder manufacturer or supplier providing a new production machine, having screw designs validated against calculated torque requirements - rather than simply copied from the pilot configuration - reduces the risk of discovering at commissioning that steady-state torque sits uncomfortably close to the gearbox ceiling.
The value is especially clear for machine rebuilders and compounders who run diverse product portfolios. A screw configuration optimized for one material on a pilot extruder may overload the drivetrain when scaled up for a different, higher-viscosity formulation. Custom design services bridge that gap by accounting for material-specific rheology, thermal sensitivity, and the geometric realities of the target production machine - translating calculated torque requirements into a screw build that actually delivers the intended process performance within safe mechanical limits.
Geometric similarity provides the theoretical framework. SEI preserves product quality across scales. But the screw configuration is where theory meets the barrel - and getting it right at production scale is what turns a torque calculation on paper into a validated, repeatable manufacturing process.
Putting It All Together as a Practical Torque Calculation Workflow
Geometric similarity gives you the theoretical scaffold. SEI preserves product quality across machine sizes. Screw element selection shapes the torque profile along the barrel. And material properties set the baseline viscous load on the drivetrain. Each of these concepts delivers value individually - but their real power emerges when they work together as a single, repeatable engineering workflow that any extrusion professional can follow from start to finish.
What follows is that workflow, distilled from every equation, principle, and practical insight covered in the preceding sections. Whether you are evaluating a high torque series twin screw extruder for sale, troubleshooting a machine running uncomfortably close to its torque ceiling, or scaling a pilot formulation to production, the sequence below provides a structured path from raw process requirements to a validated operating point.
Step-by-Step Torque Calculation Workflow
Imagine you have a new compounding project on your desk. The formulation is defined, the target throughput is set, and you need to confirm that a specific machine can handle the job - or select one that can. Here is the calculation sequence, in the order that eliminates uncertainty most efficiently:
- Define target throughput and product SEI. Pull the required specific energy input from pilot-scale trial data, published processing references for similar polymer-filler systems, or material supplier recommendations. A glass-fiber-reinforced polyamide might need 0.20-0.30 kWh/kg; a simple color masterbatch might require only 0.08-0.12 kWh/kg. If no data exists, run a small-scale trial specifically to establish this number - it anchors every calculation that follows.
- Select target screw speed based on shear sensitivity. Shear-sensitive polymers like PVC or certain biopolymers demand lower RPM to avoid degradation. Robust commodity resins tolerate 600-1,200 RPM. The screw speed you choose here directly determines the torque-power split: lower speed means higher torque per revolution, higher speed means lower torque but greater power demand.
- Calculate required torque per shaft. Apply the rearranged SEI-torque equation: Tshaft = (SEI × Q) / (2π × N × 2), where Q is throughput in kg/s and N is screw speed in rev/s. This gives the minimum shaft torque needed to deliver the target energy at your chosen operating point.
- Compare against machine rated torque. Check that the calculated value stays below 80-85% of the machine's rated per-shaft torque. That 15-20% margin absorbs cold-start torque spikes - which can exceed steady-state values by 20-40% - as well as feeder surges and batch-to-batch feedstock variability.
- If torque exceeds limits, adjust the operating point. Three levers are available: increase screw speed (redistributes energy across more revolutions, lowering per-revolution force), reduce throughput (less material means less viscous resistance), or raise barrel temperatures (lower melt viscosity reduces shear stress on screw surfaces). Each lever carries trade-offs - higher speed increases power draw, lower throughput hurts economics, higher barrel temperatures risk degradation - so choose based on the specific formulation's constraints.
- For new machine selection, normalize to torque density. Convert each candidate machine's per-shaft torque to Md/a³ (Nm/cm³) and compare across OEMs. This eliminates the confusion of different machine sizes, different spec-sheet conventions, and different torque reporting methods. A super-high torque series twin screw extruder at 15+ Nm/cm³ provides substantially more mechanical headroom than a standard platform at 5-7 Nm/cm³, and the cost difference reflects that capability gap.
This six-step sequence converts what can feel like an overwhelming tangle of variables into a linear, decision-by-decision process. Each step produces a concrete number. Each number either confirms feasibility or points you to the specific adjustment needed. No guesswork required.
Common Torque Calculation Mistakes to Avoid
Even with a clear workflow, certain errors show up repeatedly - mistakes that experienced engineers still make under time pressure or when working with unfamiliar equipment. Recognizing them before they reach the purchase order or the production floor saves real money:
- Confusing total gearbox torque with per-shaft torque. Some OEMs report total torque across both shafts; others report per-shaft values. Mixing the two introduces a 2× error - enough to make an undersized machine look adequate or an adequate machine look oversized. Always confirm the convention and normalize to per-shaft values before any comparison.
- Ignoring gearbox efficiency in motor-to-shaft conversion. A multi-stage gearbox at 97% efficiency per stage delivers only about 91% overall efficiency. Treating motor torque multiplied by gear ratio as if it arrives at the screw shaft without losses overestimates available torque by nearly 10%. For borderline applications, that gap is the difference between safe operation and a gearbox failure.
- Comparing extruder torque specs without normalizing to Md/a³. A 75 mm machine with 5,000 Nm per shaft sounds more capable than a 40 mm machine with 1,200 Nm per shaft - but the smaller machine might actually have higher torque density, meaning it extracts more mechanical performance from its drivetrain relative to its size. Raw Nm comparisons across different screw diameters are meaningless without volumetric normalization.
- Overlooking how screw element configuration changes torque demand. Two machines with identical ratings, running the same material at the same throughput and speed, can show torque readings that differ by 20-40% depending on screw build. An aggressive kneading-heavy configuration consumes far more torque than a gentle distributive mixing layout. Calculating torque from SEI alone - without considering the screw design's influence - misses this variability entirely.
- Using peak torque ratings as continuous-duty values. Spec sheets sometimes list intermittent peak torque alongside (or instead of) continuous ratings. A reliable operating guideline is to run at 80% of continuous torque capacity, not 80% of a peak rating that the gearbox can sustain for only seconds at a time.
- Assuming linear scale-up from pilot to production. Torque scales with D³ under geometric similarity, but heat transfer scales with only D². This mismatch means production machines behave differently than pilot equipment under identical setpoints, often requiring screw configuration or temperature adjustments that alter the torque profile. Applying pilot torque data directly to a production machine without thermal correction invites surprises at commissioning.
Every item on this list traces back to a fundamental concept covered earlier in this guide. The workflow catches most of these errors naturally - but awareness of the specific traps adds an extra layer of protection, especially when evaluating high torque series twin screw extruder cost or comparing super-high torque series twin screw extruder price quotes from multiple suppliers.
Turning Calculations into Optimized Production
Torque calculation is not an academic exercise. It is a practical engineering tool that serves three distinct functions in daily operations: machine selection, process optimization, and troubleshooting. Each function uses the same underlying math but applies it with a different intent.
During machine selection, you calculate torque to answer the binary question: can this extruder handle my formulation at my target throughput? The workflow above gives you that answer with quantitative confidence, eliminating the guesswork that leads to oversized motors (wasted capital on a high torque series twin screw extruder price premium you did not need) or undersized gearboxes (production shutdowns and costly repairs).
During process optimization, torque calculations reveal the trade-off landscape. Should you increase screw speed to reduce torque and create headroom for higher throughput? Or will the resulting power increase exceed the motor's capacity? Should you modify the screw configuration to shift torque consumption away from aggressive kneading zones? The equations quantify every option, turning intuition into data.
During troubleshooting, a sudden change in torque percentage at unchanged process settings is one of the most reliable diagnostic signals available. It tells you - before any quality test confirms it - that something about the incoming material has shifted: moisture content, molecular weight distribution, filler particle size, or even a supplier substitution that nobody reported. Maintaining specific energy and torque records for every product creates the baseline that makes these diagnostic insights possible.
Yet calculations alone define only the mechanical boundaries. Unlocking the performance within those boundaries requires screw geometry that is engineered around your specific polymer, filler package, and throughput target - not around generic assumptions. The arrangement of conveying elements, kneading disc stagger angles, and mixing section placement must reflect how your material actually behaves under shear and heat. This is where combining correct torque calculations with expert screw design closes the loop between theoretical requirements and validated production results.
NANHAIYA's Custom Screw Design Services support exactly this integration, providing extrusion engineers and machine rebuilders with screw geometry recommendations, material selection guidance, and processing parameters matched to specific polymers, machine conditions, and output requirements. Rather than accepting a generic screw layout and hoping the torque numbers work out, an application-driven design approach engineers the element sequence around documented material behavior - ensuring that the calculated torque budget is spent where it delivers the most processing value.
Calculate torque to understand your machine's limits, then optimize screw design to work within them efficiently.
That single principle ties together every formula, every benchmarking metric, and every material-specific insight in this guide. The equations give you clarity. The screw design gives you performance. Together, they transform a twin screw extruder torque calculation from a number on a spreadsheet into a production line running at its full, validated potential.
Frequently Asked Questions About Twin Screw Extruder Torque Calculation
1. How do you calculate torque on a twin screw extruder?
Start with the power-torque-speed equation: T_total = (P x 60) / (2pi x N), where P is motor power in watts and N is screw speed in RPM. Divide the result by 2 to get per-shaft torque for a co-rotating machine. For process-based estimation, use the specific energy input (SEI) method: T_shaft = (SEI x Q) / (2pi x N x 2), where Q is mass throughput in kg/s and N is in rev/s. Always account for gearbox efficiency (typically 0.95-0.97 per stage) when converting motor torque to shaft torque, and confirm whether OEM specs list total or per-shaft values to avoid a 2x sizing error.
2. What is torque density (Md/a3) and why does it matter for extruder selection?
Torque density equals the allowable torque per shaft divided by the cube of the centerline distance between the two screws (Md/a3 = T_shaft / a3), expressed in Nm/cm3. It normalizes torque capacity across different machine sizes so you can meaningfully compare a 27 mm lab extruder with a 92 mm production unit. The industry recognizes three classes: standard (up to 5 Nm/cm3), high torque (5-10 Nm/cm3), and super-high torque (above 10 Nm/cm3). When evaluating machines from multiple OEMs, converting every candidate to Md/a3 eliminates confusion caused by different spec-sheet conventions and machine sizes.
3. What does the torque percentage on an extruder control panel mean?
Most twin screw extruder HMI screens display torque as a percentage of the machine's maximum rated torque, not as an absolute Nm value. To convert, multiply the displayed percentage by the machine's rated per-shaft torque: T_actual = (Torque% / 100) x T_max. For example, 75% on an 800 Nm-rated machine equals 600 Nm of actual shaft load. Sustained operation above 80-85% signals that the process is approaching the gearbox's mechanical limit and may need screw speed, throughput, or temperature adjustments.
4. How do you scale up torque requirements from a pilot to a production twin screw extruder?
Under geometric similarity, both throughput and torque scale with the cube of the screw diameter ratio: T2 = T1 x (D2/D1)3. However, heat transfer efficiency scales with only D2, so production machines dissipate proportionally less heat than pilot units. This mismatch means real-world scale-up often falls between the D2 and D3 exponents. The safest approach is to use the cubic law as an initial estimate, verify by matching specific energy input (SEI) to pilot values, apply a thermal correction if needed, and ensure calculated torque stays below 80% of the production machine's rated capacity. Services like NANHAIYA's Custom Screw Design (https://www.nhyscrews.com/services/custom-screw-design) can tailor screw geometry for production-scale thermal and torque requirements.
5. Which screw elements consume the most torque in a twin screw extruder?
Reverse conveying elements and reverse kneading blocks generate the highest local torque demand because they actively push material backward, creating intense pressure buildup and shear stress. Neutral 90-degree kneading blocks rank next, followed by forward kneading blocks and fully filled conveying elements. Partially filled conveying elements contribute the least torque. Swapping a dispersive kneading block for a distributive mixing element, or shortening an aggressive kneading section by one or two discs, can meaningfully reduce total torque consumption without necessarily compromising product quality - provided the change is guided by the mixing objective for the specific formulation.
Written by
Nanhaiya Technical Team
Zhoushan Nanhaiya Plastic Machinery Co., Ltd.
The Nanhaiya technical team supports screw and barrel manufacturing projects through application review, technical communication, custom manufacturing coordination, and production and quality control.
Discuss Your Application
Related Articles
More insights on screw barrel technology and plastics processing.
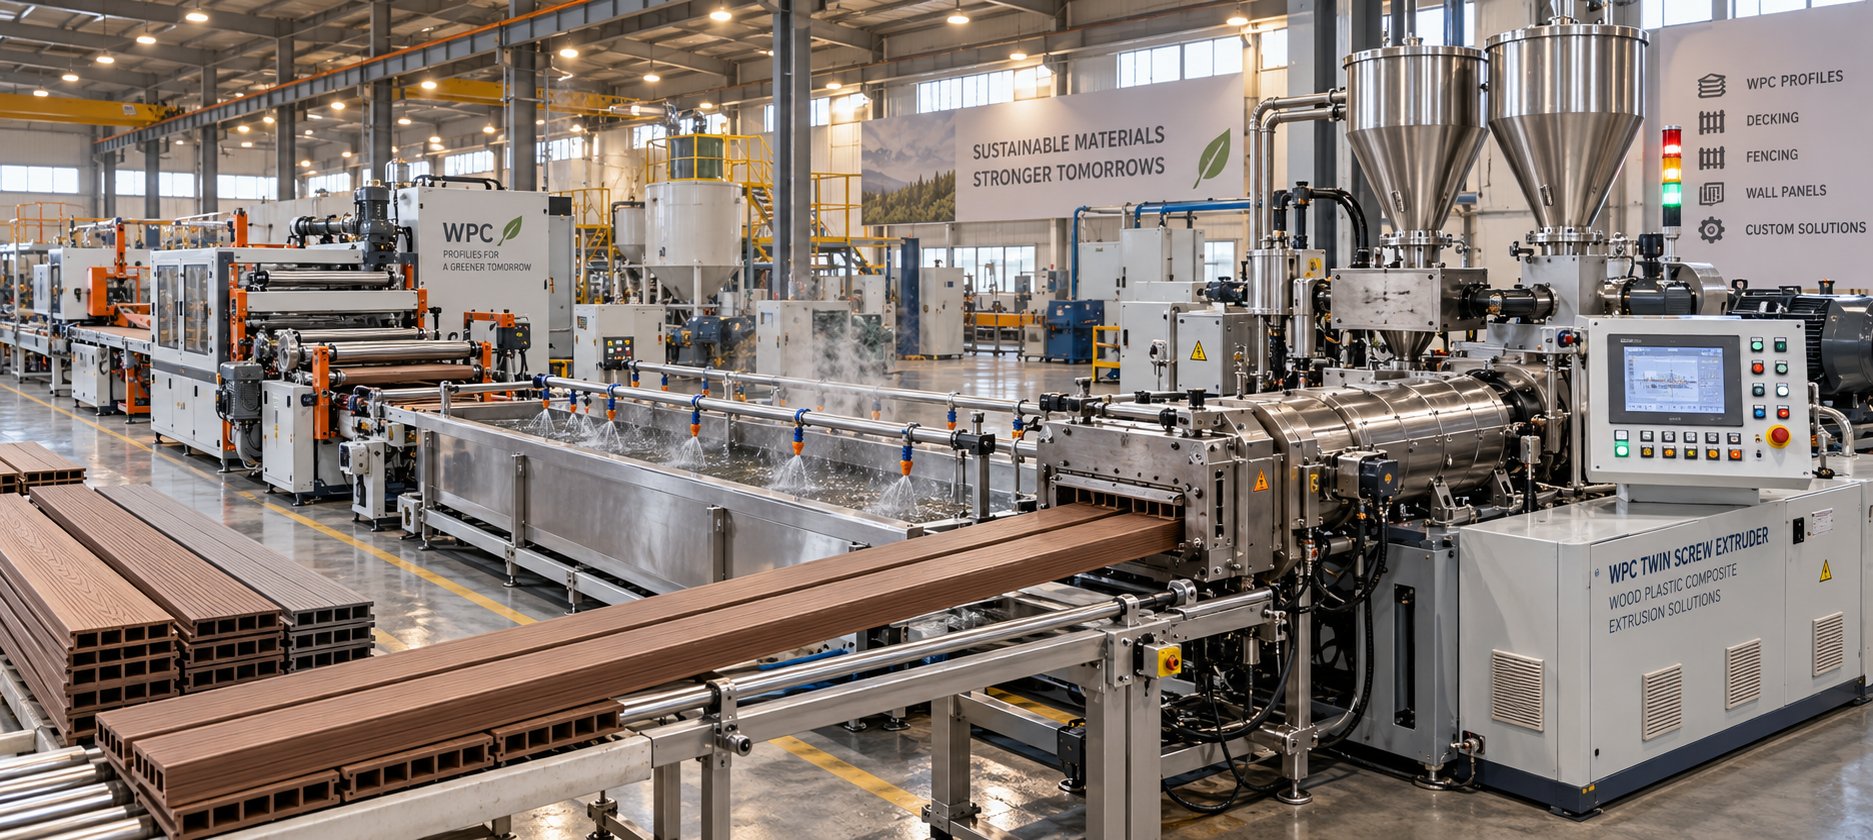
WPC Profile Extrusion Machine Decoded: Raw Blend To Flawless Profile
Oct 15, 2026
Learn how a WPC profile extrusion machine works — from extruder types and temperature zones to troubleshooting, wear management, and emerging co-extrusion trends.
Read Article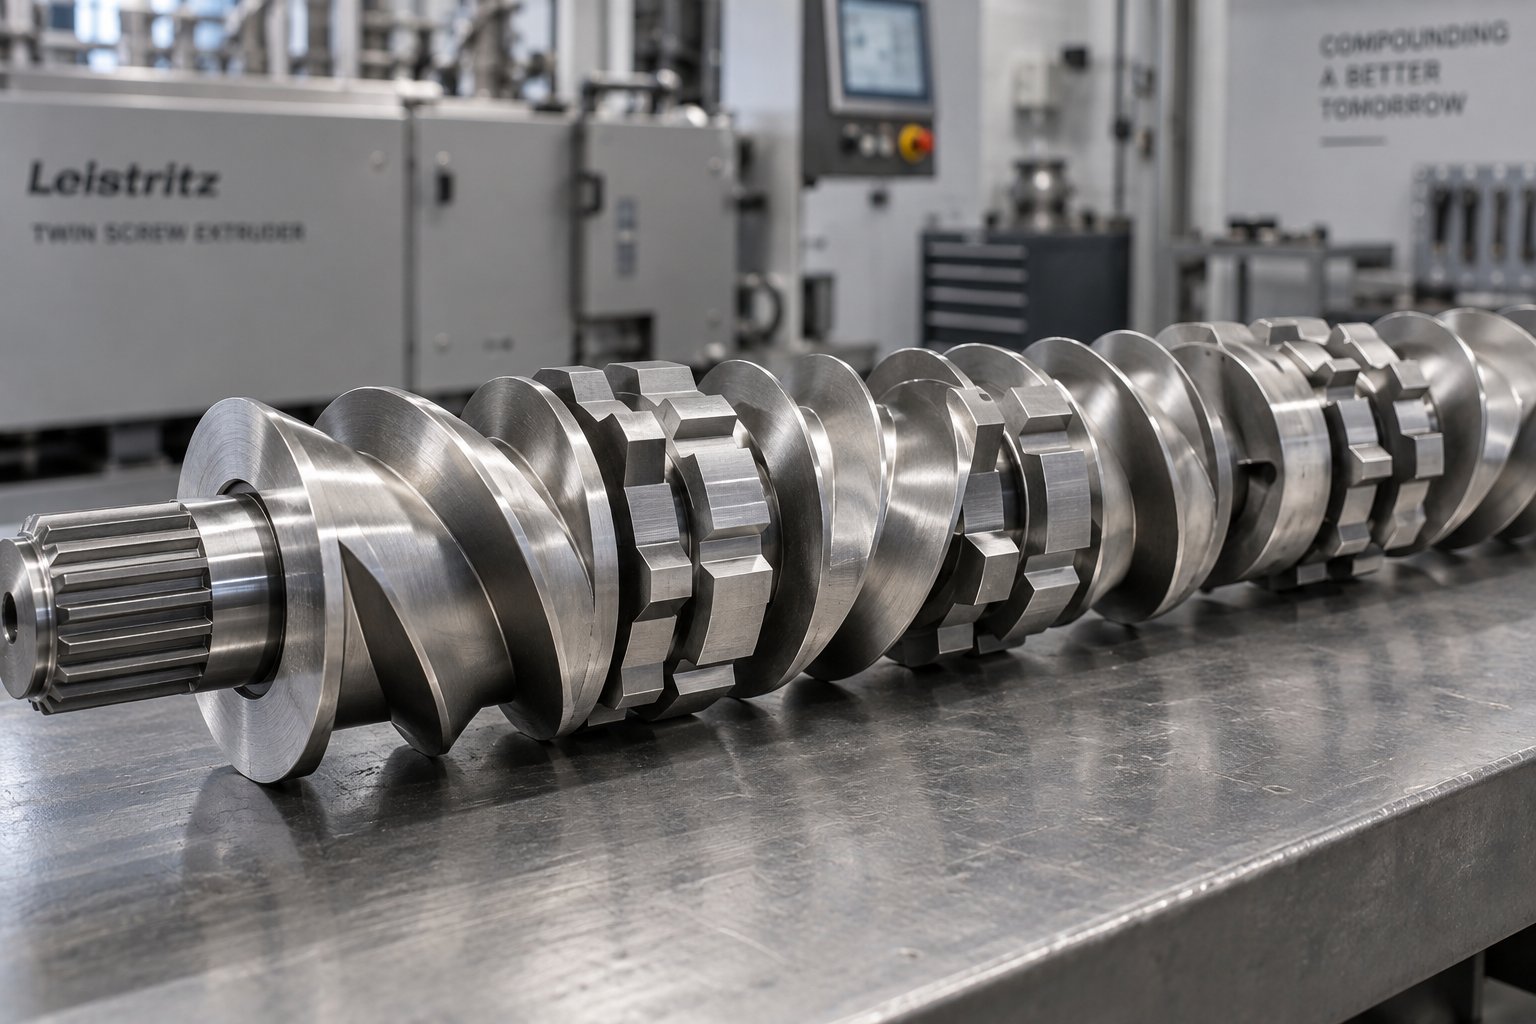
Twin Screw Extruder Screw Decoded: Geometry, Wear & Profile Fixes
Oct 14, 2026
Master twin screw extruder screw design: geometry parameters, kneading block stagger angles, element classification, wear mechanisms, and profile troubleshooting fixes.
Read Article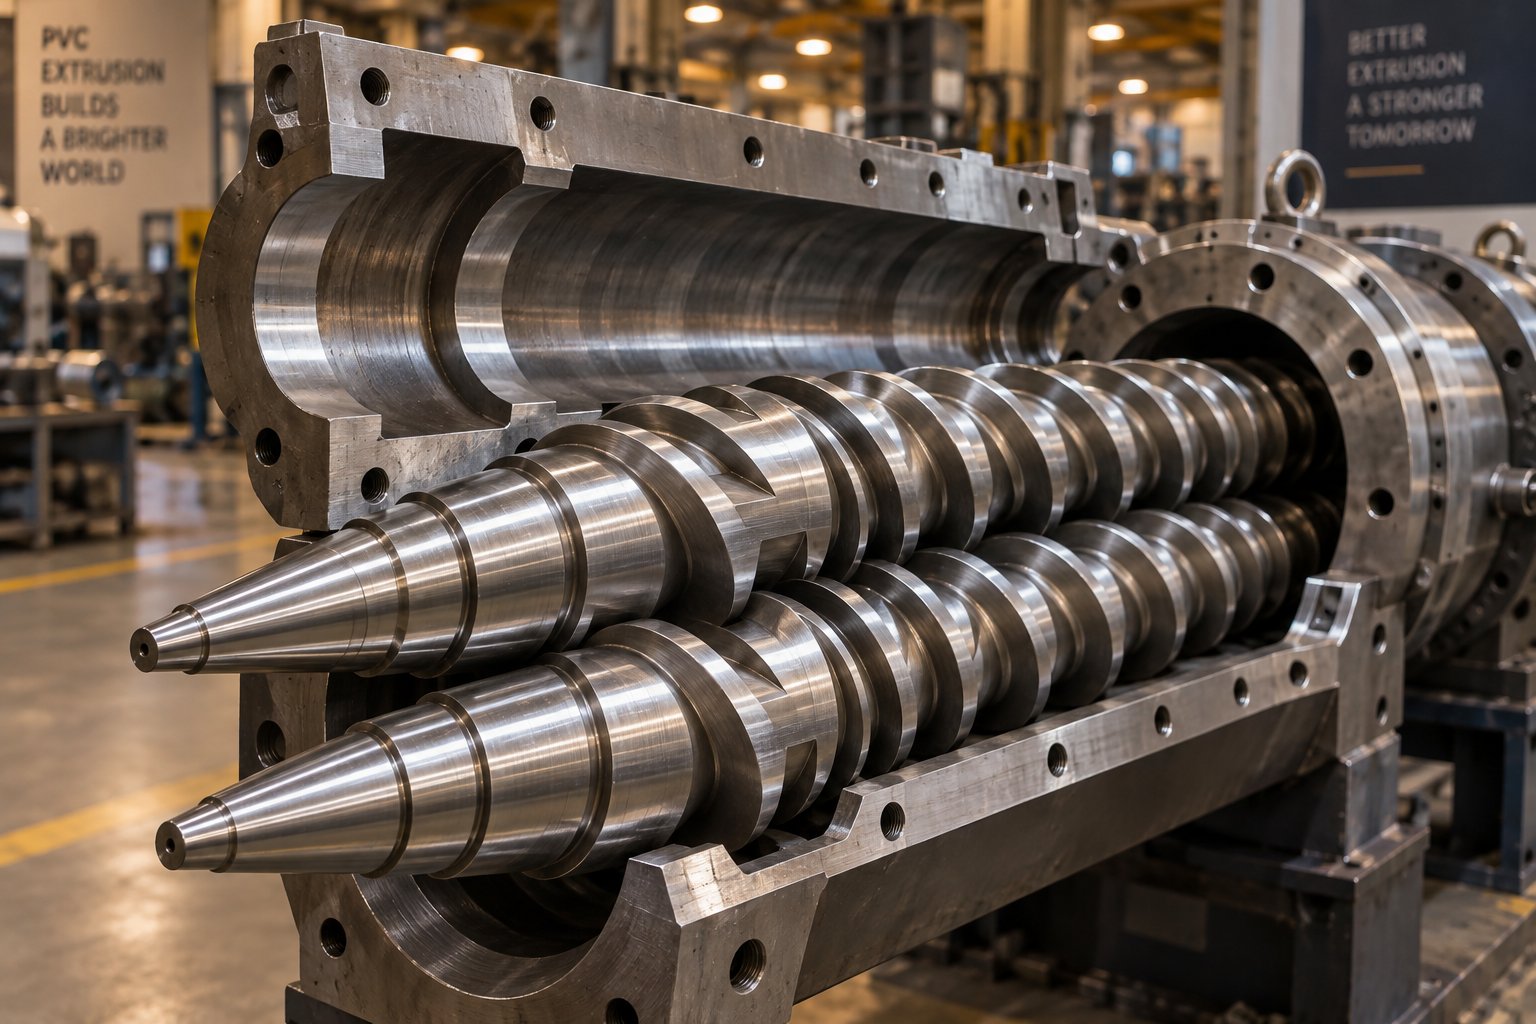
Your Extruder Screw Barrel For PVC Is Burning Resin — Here's Why
Oct 14, 2026
PVC burns resin when screw barrel geometry, metallurgy, or temperature zoning is wrong. Learn the exact specs, alloys, and wear fixes for PVC extrusion.
Read ArticleLooking for something else?
Search by material, symptom or product and jump straight to the relevant page.
These are navigation suggestions based on keyword matching — not a quotation, not a delivery commitment, and not a substitute for engineering review. Final specification is confirmed by our engineers against your drawings and processed material.
Need help with screw barrel selection?
Share your machine model, processed material and application. Our team can help with pricing and technical support.